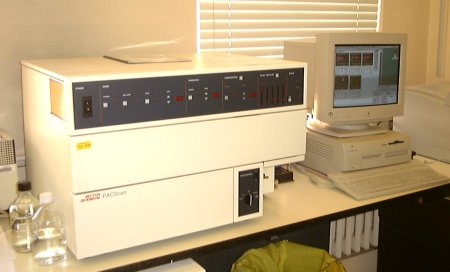
Becton-Dickinson FACScan Flow Cytometer
Becton-Dickinson FACScan Flow Cytometer
A flow cytometer is an instrument for detecting and measuring the amount of fluorescent dye on particles, and basically consists of one or more lasers for supplying excitation energy, and a series of filters and detectors for measuring the resultant fluorescent emissions.
Two further detectors measure additional physical characteristics of particles independently from the fluorescence:
A standard flow cytometer has the capacity to detect 3 or 4 fluorescent colours and two physical parameters, allowing up to 6-parameter measurements on samples under investigation.
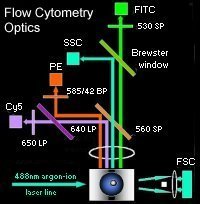 In this illustration of the optical system of a 3-colour flow cytometer (as viewed from above), cells are depicted passing through the line of the 488nm argon-ion laser. Fluorescence emitted by cell-bound fluorochromes at 90o to the excitation line is captured by four separate detectors after negotiating a series of barriers and filters.
The band-pass filters are designed to restrict transmission of wavelengths either above (long-pass; LP) or below (short-pass; SP) their designated limits.
The first filter encountered by fluorescent light is the 560SP, allowing passage of wavelengths below 560nm (FITC emissions), with higher wavelengths deflected. An in-line 'Brewster window' deflects a proportion of the 560SP transmissions into the side-scatter detector (SSC). Next in series is the 650LP, allowing wavelengths above 650nm to pass (Cy5 emissions), with lower wavelengths being deflected into the path of the 585/42BP. This filter allows the passage of wavelengths 21nm either side of 585nm (PE emissions). A fourth detector is located at 5o above the line of the excitation source, termed the forward-angle scatter detector (FCS).
A four-colour flow cytometry system has an additional laser / detector system located at a vertical offset from the argon-ion laser, facilitating separation of the 4th-colour fluorescence emissions by exploiting the time-delay in signal processing.
Cells to be investigated are labelled with one or more fluorochrome-labelled antibodies, washed free of any excess unbound antibody, then analysed by flow cytometer. The amount of fluorescence and light-scatter indices are recorded for every cell passing through the system, and normally processed by computer for live and/or 'off-line' analysis.
Data can be displayed in the form of single-colour histograms (rarely used in multi-parameter analysis), or the more informative two-dimensional 'dot-plots' whereby the relationship between two parameter is displayed, either two fluorochromes, or one fluorochrome and a light scatter characteristic.
 |
 |
 |
Flow cytometry data analysis. Left-hand plot show a one-colour histogram plot of CD8 expression by peripheral blood lymphocytes. Approximately 38% of events fall between the marker boundaries, and are therefore regarded as CD8 +ve. The centre plot also shows CD8 expression on PB lymphocytes, but depicts the relationship between CD8 and the T-cell marker CD3. It is apparent that the CD8 +ve population depicted by the histogram contains two CD3-defined sub-populations (CD3+ve and CD3-ve), and that the CD3-ve fraction (lower right quadrant) expresses CD8 at a lower intensity than the CD3+ve fraction (upper right quadrant). The right-hand plot shows a population of CD34 +ve 'stem cells' plotted against side scatter. |
||
Some flow cytometers also have the ability to isolate or 'sort' particles of interest once identified, either using a mechanical device which swings into the path of the cell as it moves through the system, or alternatively by using an electric charge to deflect the cell into a collecting vessel.
Comments & feedback to: admin@hmds.org.uk